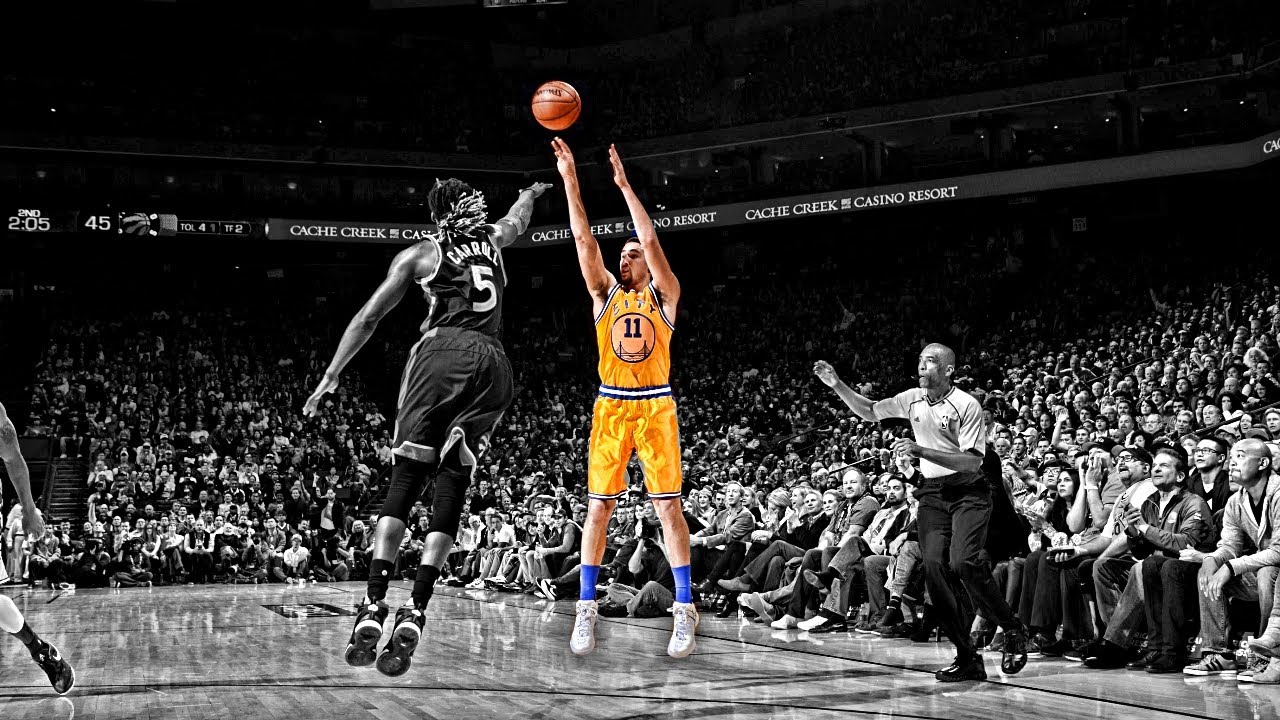
Is 3-point Shooting The Key To Winning In The NBA
Are the players in today's game better 3-point shooters?

Growing up coaches always told me “take the easy lay-up, take the high percentage shot, do not shoot the three.” Now shooting from the three point line and further back is at the forefront of the game. If your team can’t shoot the three well they aren’t winning, but is that true? In this short analysis I examine how the volume of threes taken and the ability of players shooting the three might have changed from era to era. To do this I took a deep dive into every team’s total stats for any full season (not using 2011-12, 1998-99, or 2019-2020) where the three point line was a part of the game (1980 and after) to analyze the correlation of three point shooting to winning. Afterwards, I used random forest and extreme gradient boosting to create a machine learning model that would predict wins and output which part of the game was most valuable in predicting the wins.
As stated above, I started simple looking for correlation between 2-point percentage and wins then 3-point percentage compared to wins. The marks on the plot are from every team in the history (since the 3-point line was put in) who played a full season. Both figures have a simple linear regression line showing how much of an effect the x-axis variable has on Wins. Both variables were significantly not zero by a t-test but two-point shooting explained 27 percent of the variance in wins compared to 3 percent from three-point percentage. Three-point shooting alone doesn’t seem to explain winning throughout time.
Overall throughout the NBA three-point shooting hasn’t been a defining factor to winning. But watching games now it sure looks like it. Are players in this era shooting the three ball more often and better? The three charts below show that the answer is yes and no. In an average season in each era you can see the number of three pointer taken and made is increasing dramatically, however they are still shooting the three around the same percentage since the 90s.
With the volume of threes increasing in to 10s era I expected the impact of 3-point percentage to have a larger role in predicting winning. To test this theory I used random forest and extreme gradient boosting for each era: the 80s, 90s, and 00s and the 10s. I then analyzed the feature gain which implies the relative contribution of the corresponding feature to the model calculated by taking each feature’s contribution for each tree in the model. A higher value of this metric when compared to another feature implies it was more important for generating a prediction. The results which can be seen below showed that gradient boosting gave a better mean absolute error, was able to explain more variance (for the 80s-00s model but less variance explained in the 10s model), and mocked the distribution of wins compared to random forest thus we used gradient boosting as the final model.
The variable importance chart showed that up until the 10s era 2-point percentage, turnovers, and defensive rebounds all played a more important role in predicting wins than 3-point percentage. To win games throughout history shoot the 2-point shots well, get rebounds, and don’t turn the ball over.
| Actual Wins | rf_pred | xgboost_pred | |
|---|---|---|---|
| Min. | 13.00 | 20.50 | 13.61 |
| 1st Qu. | 33.00 | 35.00 | 34.26 |
| Median | 42.00 | 40.68 | 41.05 |
| Mean | 40.83 | 40.59 | 40.53 |
| 3rd Qu. | 50.00 | 46.31 | 47.77 |
| Max. | 69.00 | 57.19 | 63.53 |
| MAE Test | NA | 6.17 | 6.35 |
| r-squared | NA | 0.60 | 0.59 |
The 10s Era
Again, gradient boosting outperformed randomforest for the 10s era. However, looking at the variable importance chart, 3-point percentage jumped all the way to the second most important variable. Up until the 10s model, the model had a gain of .34 for 2-point percentage and .05 for 3-point percentage. The 10s model had a gain of .30 for 2-point percentage and .19 for 3-point percentage, a much closer score relative to each other. This helps prove our point that the 10s era shoots more threes and because of it the 3-point percentage of a team has a significantly higher effect on winning a game.
| Actual Wins | rf_pred | xgboost_pred | |
|---|---|---|---|
| Min. | 19.00 | 28.03 | 25.52 |
| 1st Qu. | 32.75 | 37.06 | 35.62 |
| Median | 41.50 | 41.80 | 40.89 |
| Mean | 41.46 | 41.50 | 41.76 |
| 3rd Qu. | 51.25 | 46.77 | 48.72 |
| Max. | 66.00 | 60.95 | 69.73 |
| MAE Test | NA | 6.99 | 6.57 |
| r-squared | NA | 0.56 | 0.53 |
All together, my quick analysis displays that throughout history the way to win games was shoot a high percentage inside the arc, get defensive rebounds, and don’t turn the ball over then shoot 3-pointers well. This leads to a “big man’s” game. Big men shoot very high percentage shots due to being close to the basket and then they make sure the other team only gets one chance to score by getting the defensive rebound. This pointed us to believe that a 3-point specialist and a big man’s game would be the way to win the most games until the 10s era in NBA history. Once we looked at the 10s era a different story was told. 3-point percentage shot up and diminished 2-point shooting percentage gain in our importance model with turnovers following shortly behind. The numbers tell us the game has changed, wonder what the 20s era will look like!